Debugger Interface
The debug interface contains a menu, a toolbar and the source frame where the code lines are displayed for the object that is currently being executed.
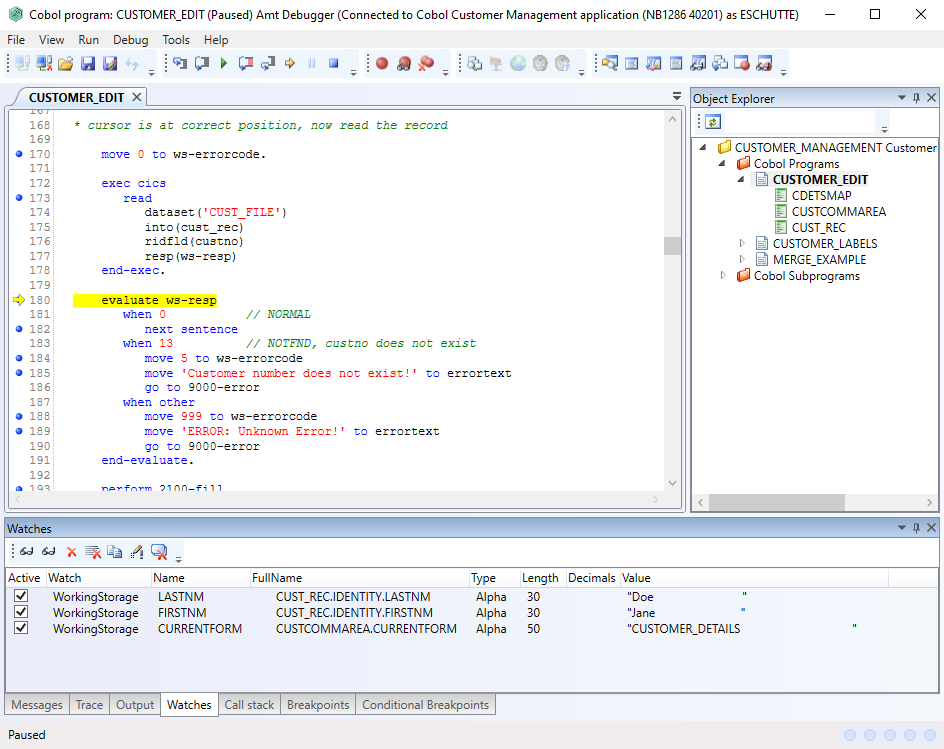
Source frame
This frame displays the code lines of the item being debugged.
When the mouse cursor is placed on a variable in this frame, the value of this variable will be displayed.
Variables can be added to the list of watch items by clicking the right mouse button.
By checking the dot on the left of a line, you can set or remove a break point for that line. A blue dot indicates the breakpoint is off, a bigger red dot indicates the breakpoint is on. When a breakpoint is on it also changes the color of the line as is set in the options screen under Font & colors. If the program reaches a breakpoint, it stops execution.
There are 8 frames which can be added to the screen to show more information.
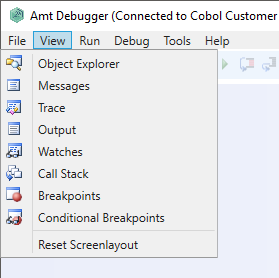
The available frames are Object Explorer, Messages, Trace, Output, Watches, Call Stack, Breakpoints and Conditional Breakpoints and can be organized as you like. By clicking View in the menu one of the frames can be chosen. It will open as a popup window but can be placed on the left, right, top or bottom of any frame. It is also possible to place it on an existing frame as an extra tab sheet. To move a frame just left click the top blue bar of the frame and hold the mouse down. Now you can move the frame to any place on the screen.
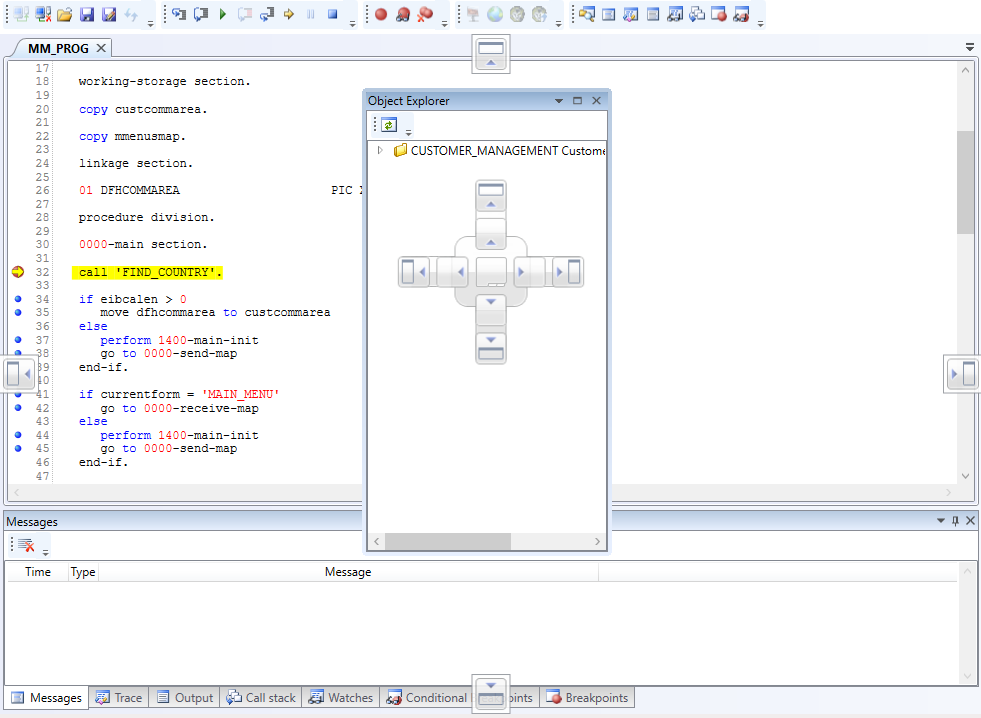
As long as you hold down the mouse button extra images are available on the screen, representing places where the frame can be located. In the frame you are currently positioning the new frame the following image appears:
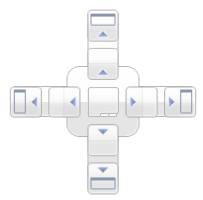
When you drag the new frame to the square on top of this image, the new frame will be placed on top of the underlying frame. Dragging it to the right square means of course placing it on the right and so on. When you drag the new frame to the middle square the new frame will be placed on the same location as the existing frame, as a new tab sheet.
The single squares on the edges of the screen represent a position on that side of the screen, thus not in a frame.
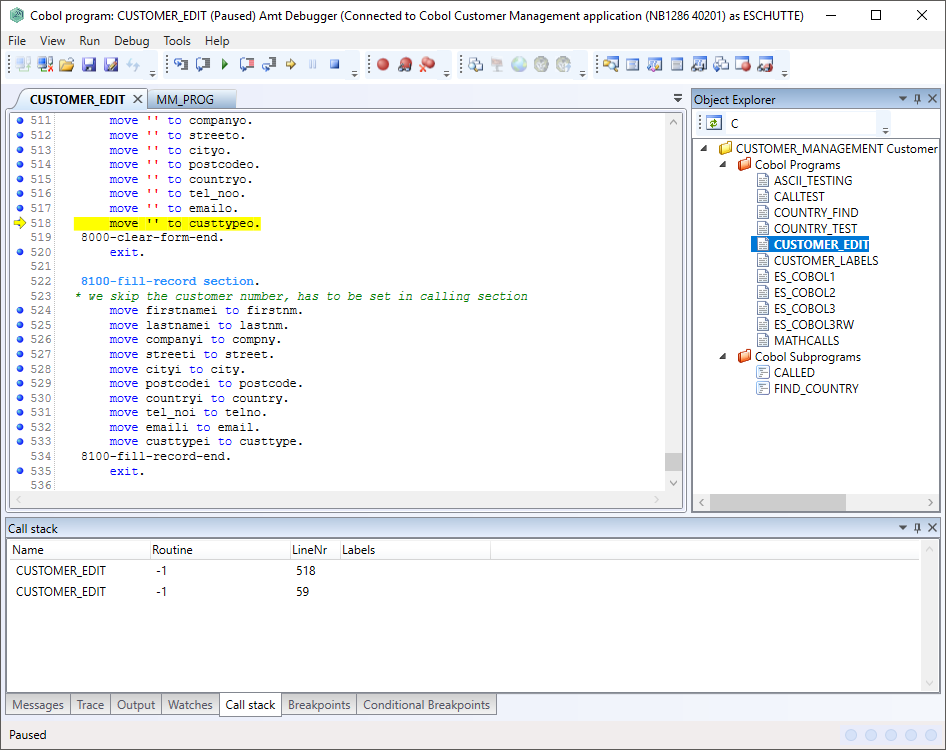
Object Explorer
This frame displays the object and its items being debugged. Only the Programs and Subprograms which are generated in debug mode are shown.
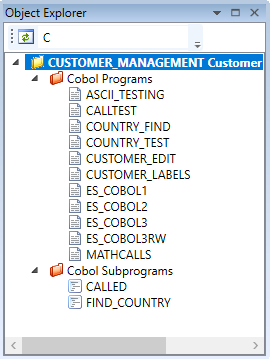
In the toolbar there is a refresh button and a filter text box. Clicking the refresh data button will refresh the object explorer. With the filter text box, the displayed list of objects will be shortened to only show the objects names that contain the entered filter. When the text box is empty all the available objects will be displayed. In the screenshot above, all the objects that contain the letter 'C' are displayed.
When the object explorer has focus, pressing a letter will select the next object that starts with that letter.
There is no right-click menu. In the tree itself it is possible to double-click an item. This will open the source code of that item in the source frame.
Messages
This frame displays the messages generated in the debugged source.
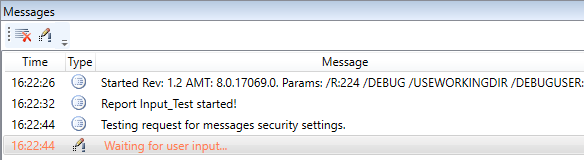
User input requests are also displayed in this frame, double clicking on the request opens the Request confirmation window.
If you do a right mouse click in this frame, a popup-menu is displayed with one option.
This is the same as the first option in the toolbar on top of the frame.
The following options are available in the toolbar:
- Clear all messages: This clears all outputs
- Request confirm: This opens a windows where input requests can be answered.
Request confirmation
In the Request confirmation window, you can answer input requests.
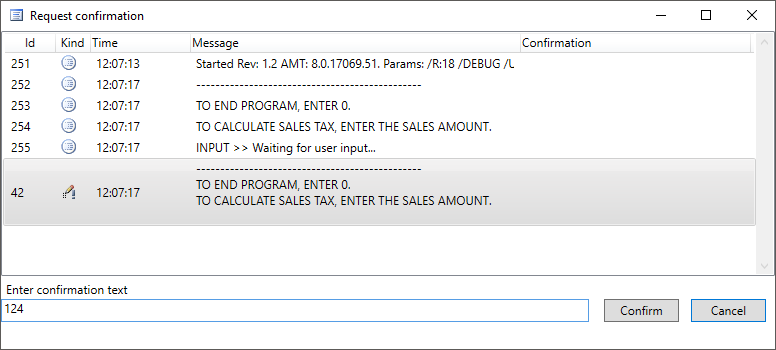
If there are multiple input requests in a short amount of time, it might be needed to manually select the correct request.
Trace
This frame displays the trace. That is the name of the object and routine that are currently running.
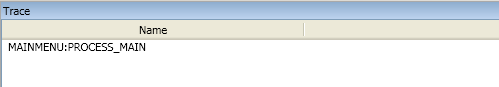
There are no additional options in this frame.
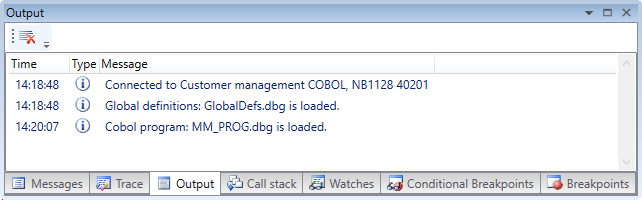
Output
This frame displays the outputs from the server.
If you do a right mouse click in this frame, a popup-menu is displayed with one option.
This is the same as the option in the toolbar on top of the frame.
The following option is available:
- Clear: This clears all outputs
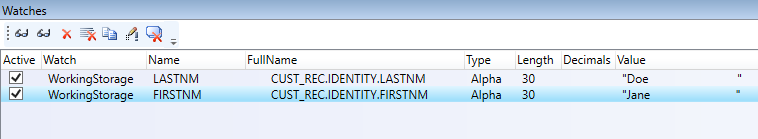
Watches
This frame displays if the watch is active, the watch type, name, full name, data type, length, decimals and the current value (which is updated during the transaction) of the items that have been added to the list of watch items on this frame if the watch is set as Active. The full name column displays the name of the item including the name of parents (structure/group item/etc.).
If you do a right mouse click in this frame, a popup-menu is displayed with options to change the selection of watch items. These are partly the same as the options in the toolbar on top of the frame.
The following options are available either in the toolbar, popup-menu or both:
- Add new watch: Opens a window where the name of an item to be watched can be entered.
- Find new watch: A popup opens showing all available items to be watched, independent of which watch-item was clicked. A find for the correct item wanted can be applied.
- Add selected watch: Adds an other watch of the currently selected watch.
- Add conditional watch: Adds a conditional breakpoint of the currently selected watch.
- Remove: This removes the watch-item that was selected.
- RemoveAll: This options removes all watch-items, independent of which watch-item was clicked.
- Copy value: Copies the value of the selected watch to your Windows clipboard.
- Edit value: Opens a windows where you can change the value of the selected watch.
- Edit watch: Opens a window where you can change the item to be watched by entering an other item name.
- Deselect all watches: Sets all watches to not active.
- Display value: Opens a sub-menu with three options to set the way the value of the selected watch is displayed. The options are:
- No Hex: Display the value in Ascii/Unicode.
- Hex Ascii: Display the Hexadecimal Ascii value of the characters.
- Hex Unicode: Display the Hexadecimal Unicode value of the characters.
Call stack
This frame displays the stack of section(Routine) calls that where made until the set breakpoint.
Breakpoints
In this frame all the breakpoints that where set for this application can be viewed. Also the breakpoint at which the debugger has stopped is shown.
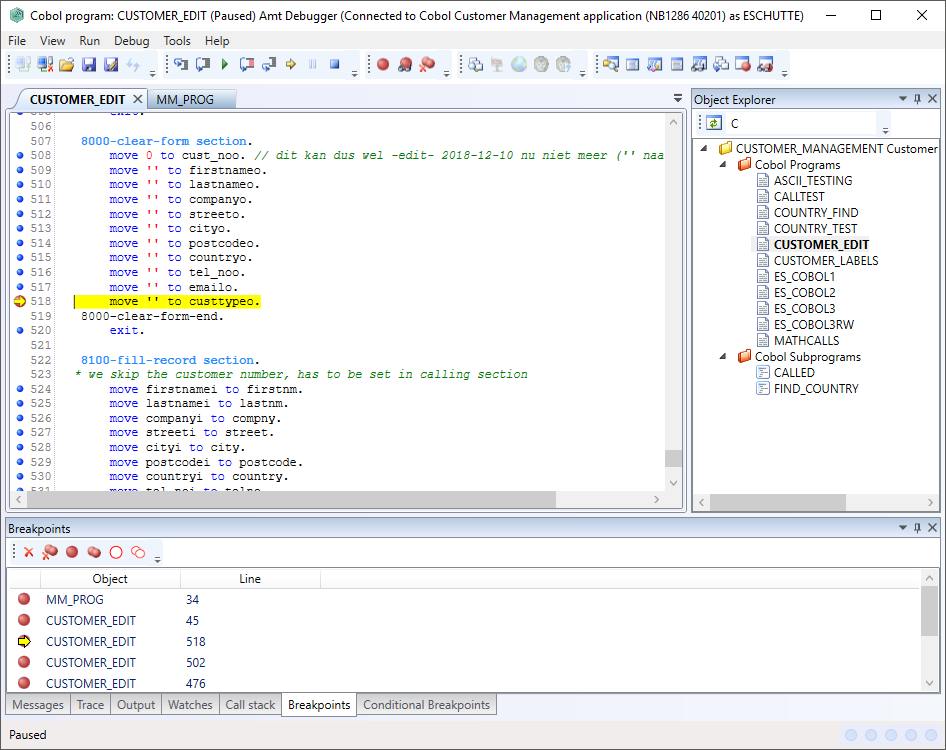
A breakpoint can be added or deleted by clicking on the blue/red dot before the line number in the code or by selecting the line in the code and clicking the Add/Delete Breakpoint button  in the top toolbar or by using the F9 key.
Also all set Breakpoints can be removed at once by clicking the Delete All Breakpoints button  in the Breakpoints view or by clicking the key combination CTRL-SHIFT-F9.
The following options are available in the toolbar at the top of the Breakpoints frame:
 Remove a breakpoint: Remove the selected breakpoint.
 Remove all breakpoints: Remove all breakpoints, independent of which was clicked.
 Enable breakpoint: Enable the selected disabled breakpoint.
 Enable all breakpoints: Enables all breakpoints, independent of which breakpoint was clicked.
 Disable breakpoint: Disable the selected breakpoint.
 Disable all breakpoints: Disable all breakpoints, independent of which breakpoint was clicked.
Conditional Breakpoints
In AMT-COBOL Conditional Breakpoints can be set on Variables. When using conditional breakpoints the values of the variables the breakpoints are set on will be evaluated after every step (line of code). This is a time consuming process, so use these breakpoints with care.The possible conditions the debugger will stop on are:
- OnChange
- OnEqual
- OnSmaller
- OnLarger
- OnSmallerOrEqual
- OnLargerOrEqual
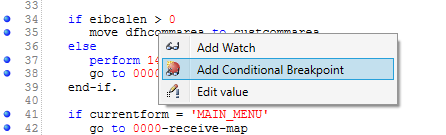
To add a conditional breakpoint, right click on a variable in the code and select 'Add Conditional Breakpoint'.
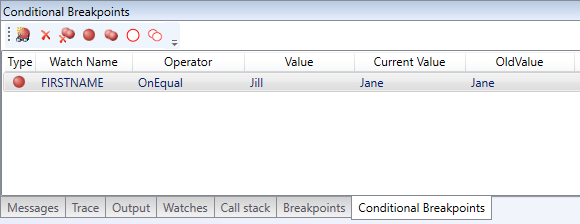
The added breakpoint will now show in the Conditional Breakpoint frame.
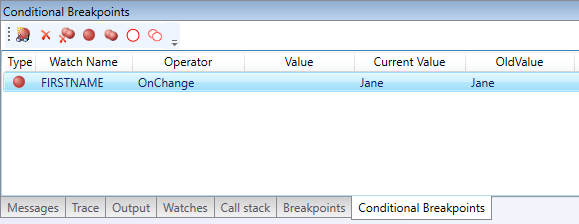
Conditional breakpoints can also be added from inside the Condition Breakpoints frame. In the toolbar of the frame click the Add Conditional Breakpoint button  . A window listing all the available variables will open.
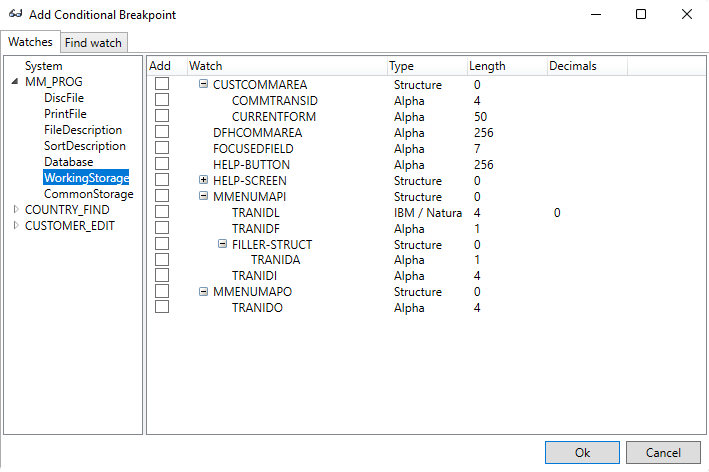
Select one or more variables to add to the Conditional Breakpoint list and click Ok.
To change the condition on the breakpoint double click the variable in the list, the Edit Condition window will open.
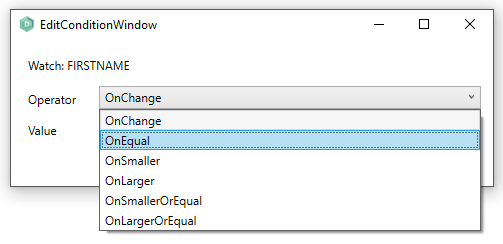
Select an Operator from the list and on all operators, except for 'OnChange', enter a value for the operator.
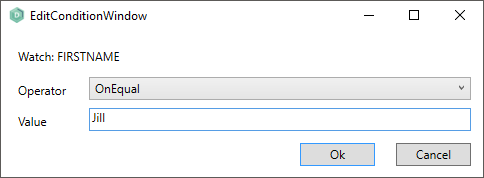
Next click Ok and the conditional breakpoint will be set and show in the list.
If you do a right mouse click in this frame, a popup-menu is displayed with options to change the selection of watch items. These are mostly the same as the options in the toolbar on top of the frame.
The following options are available:
 Add watch: Adds a watch of the selected conditional breakpoint.
 Add conditional Breakpoint: Opens a window listing all the possible conditional breakpoints.
- Remove watch Breakpoint: Removed the selected breakpoint.
- Remove all watch Breakpoints: This options removes all conditional breakpoints, independent of which conditional breakpoint was clicked.
- Enable watch Breakpoint: Enables the selected conditional breakpoint.
- Enable all watch Breakpoints: Enables all conditional breakpoints, independent of which conditional breakpoint was clicked.
- Disable watch Breakpoint: Disables the selected conditional breakpoint.
- Disable all watch Breakpoints: Disables all conditional breakpoints, independent of which conditional breakpoint was clicked.
Toolbars
All frames have another toolbar in the right upper corner with options for displaying the frame.
The source frame has one icon.

This icon gives a dropdown with all open items in the source frame. clicking one of these items makes that item the visible tab.
The other frames have three icons.

The first icon gives a dropdown with 5 options.
- Float: Makes the current frame a popup.
- Dock: Docks the current floating frame.
- Tabbed document: Makes the current frame an extra tab in de source frame.
- Auto Hide: Makes the frame auto hide. A small tab will only be visible. Hovering the mouse over this tab will show the frame again. To hide the frame again just click anywhere outside the frame. To end the auto hide mode just click Auto Hide again.
- Close: Closes the frame.
The second icon makes the frame auto hide.
The third icon closes the frame