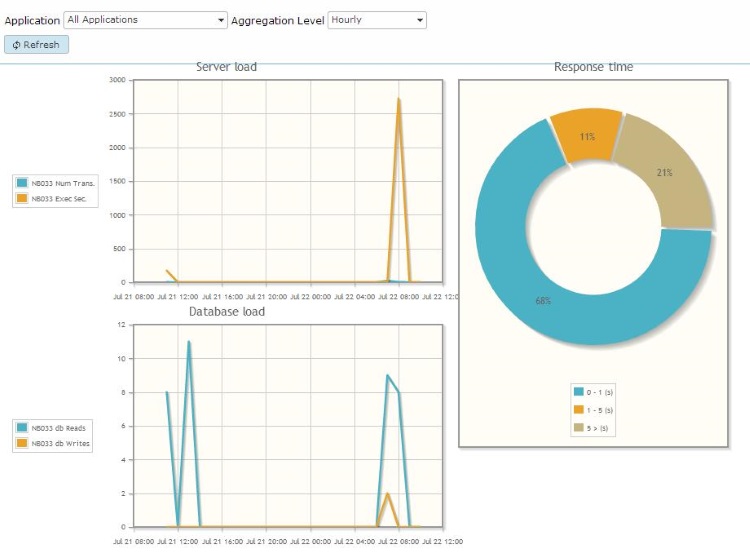
Graphical overview
This tab shows the server and database load over the last hour, day or week, depending on the Aggregation level,
of the selected applications Also a Pie graph is shown on the right to
enable a quick evaluation of the performance of the servers and database
load.