Graphical overview
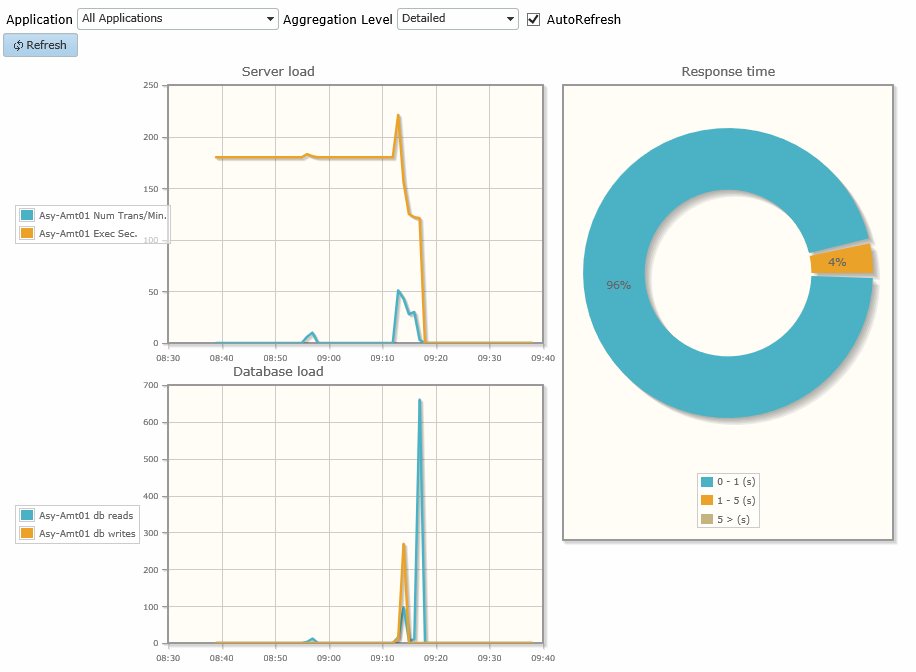
This tab shows the server and database load over the last hour, day or week, depending on the Aggregation level, of the selected applications Also a Pie graph is shown on the right to enable a quick evaluation of the performance of the servers and database load.
The view can be refreshed by hand, by clicking the Refresh button or by checking the AutoRefresh checkbox.