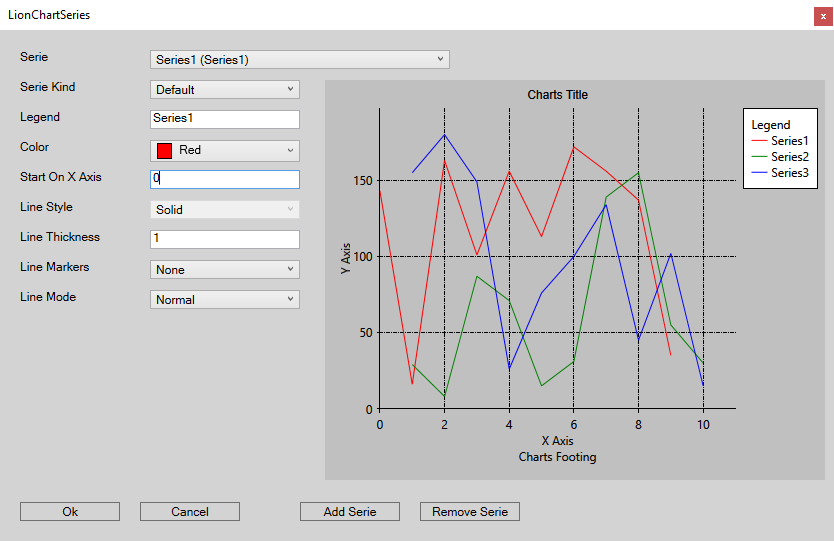
Series Editor
With the use of the series editor the number of series displayed in a Line or Bar Chart can be controlled along with the individual Series Properties.
Field Description
- Serie: The serie to set the properties of. Initially a new chart will only contain one serie. New series can be added using the 'Add Serie' button and Series can be deleted using the 'Remove Serie' button.
- Serie Kind: The type of the serie. A choice can be made between Default, Line and Bar. Default follows the type of Chart (i.e. Line or Bar). The other two enable you to place Lines in Bar Charts and Bars in Line Charts.
- Legend: The text to show in the legend box for this serie. The legend box willl only be shown when the Legend property for this chart is set to True.
- Color: Sets the color of the series
- Start On X Axis: The X value of the first datapoint added when data is added using the ADD(Value) function.
- Line Style: For Lines only, the style of the line. A choice can be made between Solid, Dash, Dot, Dash Dot and Dash Dot Dot.
- Line Thickness: For lines only, the Thickness of the line.
- Line Markers: For lines only, the type of Markers to add to the datapoints. A choice can be made between None, Square, Circle, Diamond, Triangle, Cross, Star4, Star5, Star6 and Star10 (Star4 is a four pointed star etc.).
- Line Mode: For lines only, the type of interpolation used when drawing connection lines between the datapoints. Normal draws straight lines between the datapoints, Smooth rounds the angles of the lines at the datapoints and Step draws a straight horizontal line from a datapoint up to the X value of the next datapoint in the line.
| A Pie Chart can only have one serie. When opening the Series Editor on a Pie Chart only that serie will be shown, no series can be added and no property can be changed using the Series Editor. |