Pie Chart
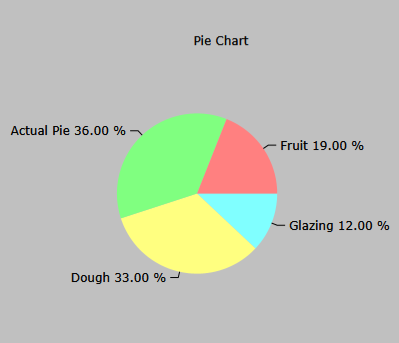
A pie chart consists of a circle with colored parts as shown in the example below. A possible legend can be added be setting the Legend property of the chart to True in the Object Inspector.
Data displayed
A pie chart can be used to display only one data set, in LION called a series. The data to display can be entered using the series1.add () command with the following syntax.
<PieChartObject>.series[1].add (<weight>, <color>, <legendText>)
Where:
- <PieChartObject> is the name of the graphic chart object added in the layout
- <weight> is the size of the part to add in the pie. The total added weight will always be normalized to the total pie chart.
- <color> is the color to use for this part. This can either be a color name from the global defined colors or a hexadecimal color code in the format $BGR.
- <legend> is the legend text to be displayed in the legend box as shown in the examples.
The data set can be cleared by using the <PieChartObject>.series[1].clear ()
command.
Code example
The chart shown above was created using the following code:
chart_pie.series[1].add (10, clblack, 'Norm')
chart_pie.series[1].add (20, $004080, 'Twice')
chart_pie.series[1].add (30, clred, 'Thrice')
chart_pie.series[1].add (40, $0080FF, 'Four times')
chart_pie.series[1].add (50, clyellow, 'Five times')
chart_pie.series[1].add (60, clgreen, 'Six times')
chart_pie.series[1].add (20, $004080, 'Twice')
chart_pie.series[1].add (30, clred, 'Thrice')
chart_pie.series[1].add (40, $0080FF, 'Four times')
chart_pie.series[1].add (50, clyellow, 'Five times')
chart_pie.series[1].add (60, clgreen, 'Six times')
Properties
Static properties:
Shown are only the properties to be used for pie charts. The property
ChartKind should be set to Pie for a pie chart.
- BorderStyle
- ChartKind
- ChartMark
- Color
- Description
- Font
- Height
- HelpText
- Left
- Legend
- Name
- Title
- Top
- Visible
- Width
- ZOrder
Dynamic properties:
Legacy properties (not supported):
- FontItalic
- FontUnderline