Server Control
The section Server Control gives access to all servers installed in the environment. A distinction (and
separation) is made between System servers and Application servers.
System servers can contain the following
services:
- Batch controller;
- Print controller;
- File controller;
- and more.
Application servers can contain the following services:
- Application controller;
- Spare Application controller;
- and more.
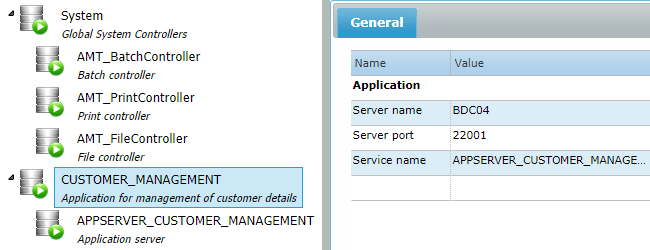
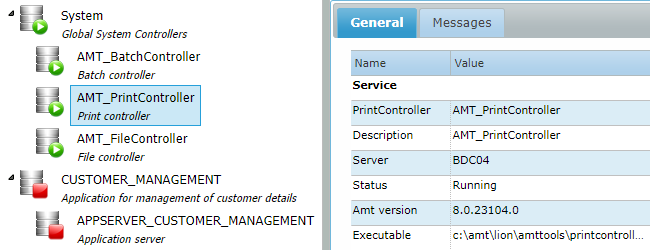
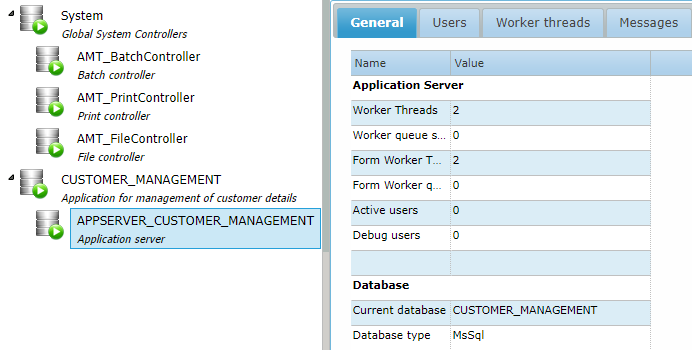
After a server or service is selected from the tree view, information about the service is displayed in the panel on the right side, as shown in the image below.
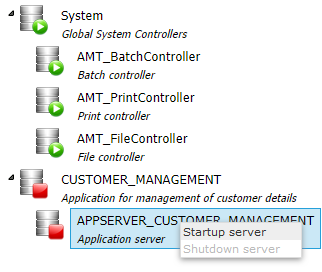
Starting and Stopping services
A service can be started or stopped by right clicking on a service and selecting Startup server or Shutdown server, respectively.
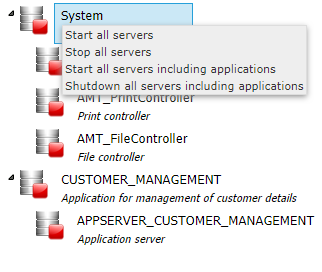
It is also possible to start or stop all services at the same time by right clicking on the root nodes and selecting Start all servers or Stop all servers, respectively. Alternatively, to start or stop all services and applications at the same time, right click on the System node and select Start all servers including applications or Shutdown all servers including applications, respectively.
A Batch Controller has two additional options to choose from after right clicking on it;
- Halt server: Halts the Batch Controller. The Batch Controller continues to run as a Windows service but does not execute any jobs.
- Resume server: Resumes the Batch Controller to execute jobs.
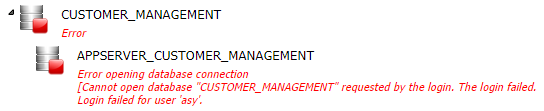
If a Service or Controller fails to start, an error message is shown.
Service State Icons
All possible states with their respective icons are listed below. A state is also displayed on root nodes. If, for example, the group displays a warning, it could mean that only one service or controller is not running.
| Icon | State | Description |
|---|---|---|
| Stopped | The service or controller is not running. For a group node, this means that no services are running. | |
| Pending | The service or controller is changing states. For a group node, this means one (or several) service is changing states. | |
| Running | The service or controller is running. For a group node, this means all services are running. |
|
| Standby | The spare service or controller is in standby and ready to take over if the main service or controller stops. | |
| Halted | The spare service or controller is halted. |
|
| Warning | One or several services or controllers in the group is not running. |
|
| Error | The service or controller encountered an error. For example, a service defined in the environment may not have been installed on the Windows server. For a group node, this means that an error has occurred for one of the services or controllers within this group. |
System Services
After a service is selected from the tree view, information about the service is displayed in the panel on the right side. The General and Messages tabs are available for the File and Print Controllers and the Reorganize Service. In addition to these tabs, the Batch Controller also has the Jobs tab.
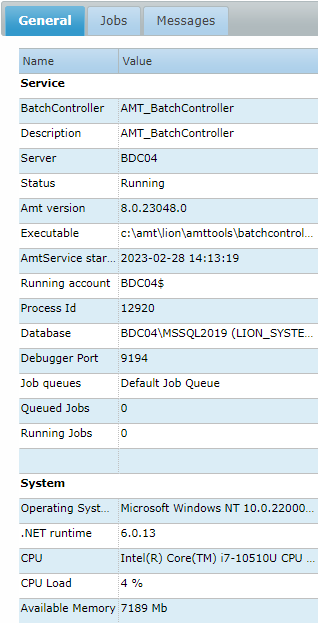
General
The General tab displays information about the status of the controller. The image below is an example of what this looks like for the Batch Controller. The Reorganize service it only displays that the service is running.
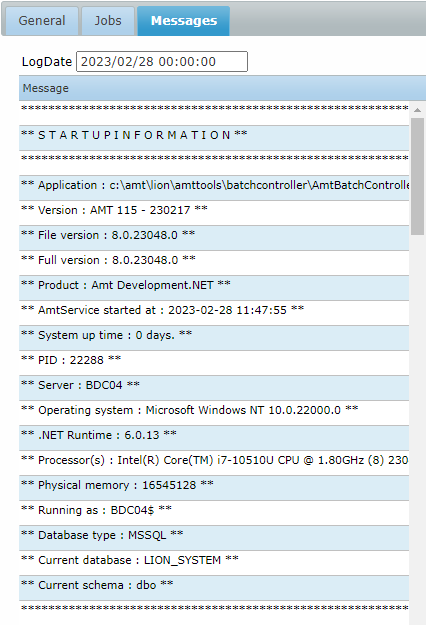
Messages
The Messages tab displays the messages of the controller that are written into logfiles. These messages can also be viewed in the Processed → Logging section in the Control Center.
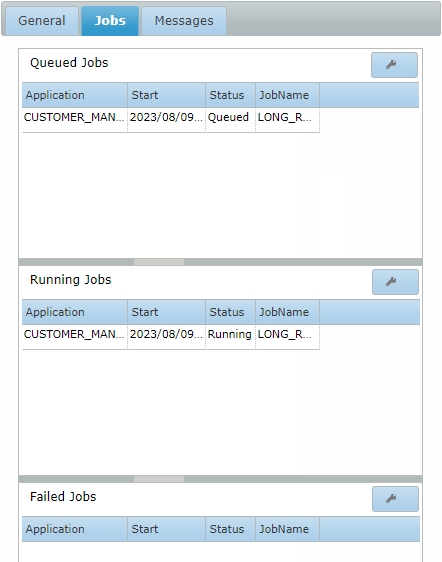
Jobs
The Jobs tab is only available for the Batch Controller. It displays the status of Queued, Running, and Failed jobs. The jobs can not be managed in this section. To manage jobs, navigate to the Jobs → Job management section in the Control Center.
Application Specific Services
While an application service is selected, detailed information on the status of that service will be displayed on the right hand side.
LION Servers
There are two types of LION servers—the Application and Communication server. While selected, information about each
server types is displayed in the panel on the right side.
A description of contents for each information tab can be found below.
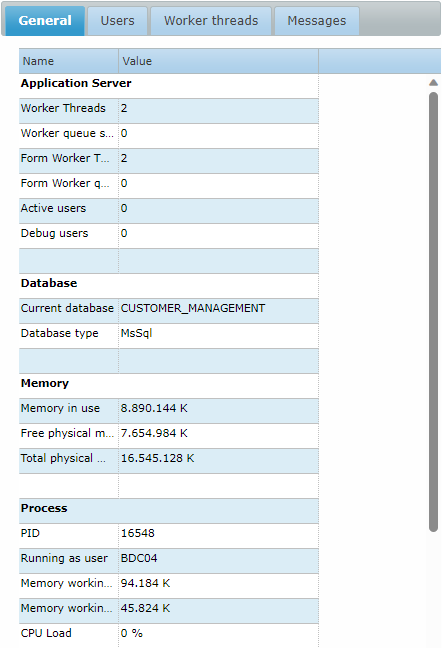
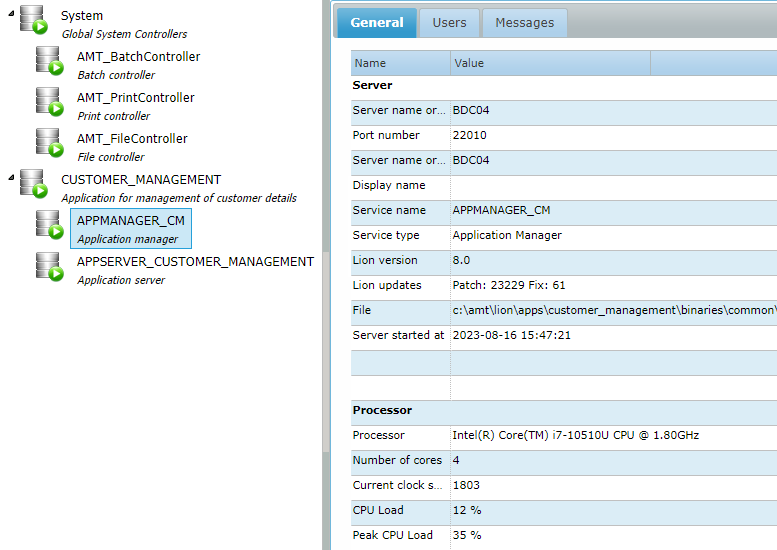
General
The General tab provides status information for the LION server and the system the server is running on. A sample of this information can be seen below.
Users
The Users tab displays the users currently logged in to the LION server. Detailed information about a user's activity, such as the Station name and the Screen the user is in, can be viewed. A filter can be applied on the User, Screen, or Station field to filter the list of user connections.
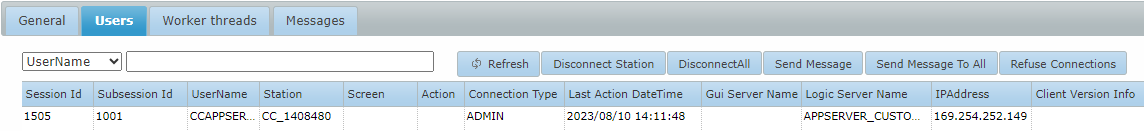
In addition, the following buttons are available to manage connections and send messages:
- Disconnect Station: Disconnects the selected Station from the application.
- DisconnectAll: Disconnects all users from the application.
- Send Message: Sends a message to the selected user.
- Send Message to All: Sends a message to all connected users.
- Refuse Connections: Prevents the Application Server from accepting new connections. The button also changes into Allow Connections, which, if pressed, the application resumes accepting new connections and the button changes back into Refuse Connections.
The following is a full list of available information columns:
- Session Id
- Subsession Id
- UserName
- Station
- Screen
- Action
- Connection Type*
- Last Action DateTime
- Gui Server Name
- Logic Server Name
- IPAddress
- Client Version Info
*The following Connection Types exist:
| Connection Type | Comes From | |
|---|---|---|
| AMTSCREENS | ↔ | AMT Screens |
| WEB | ↔ | Web interface |
| ADMIN | ↔ | Control Center |
| COMSERVER | ↔ | COM server |
Worker Threads
The Worker threads tab displays information about the worker threads of the LION server and a graphical display of Queue size, as well as the number of transactions per second.
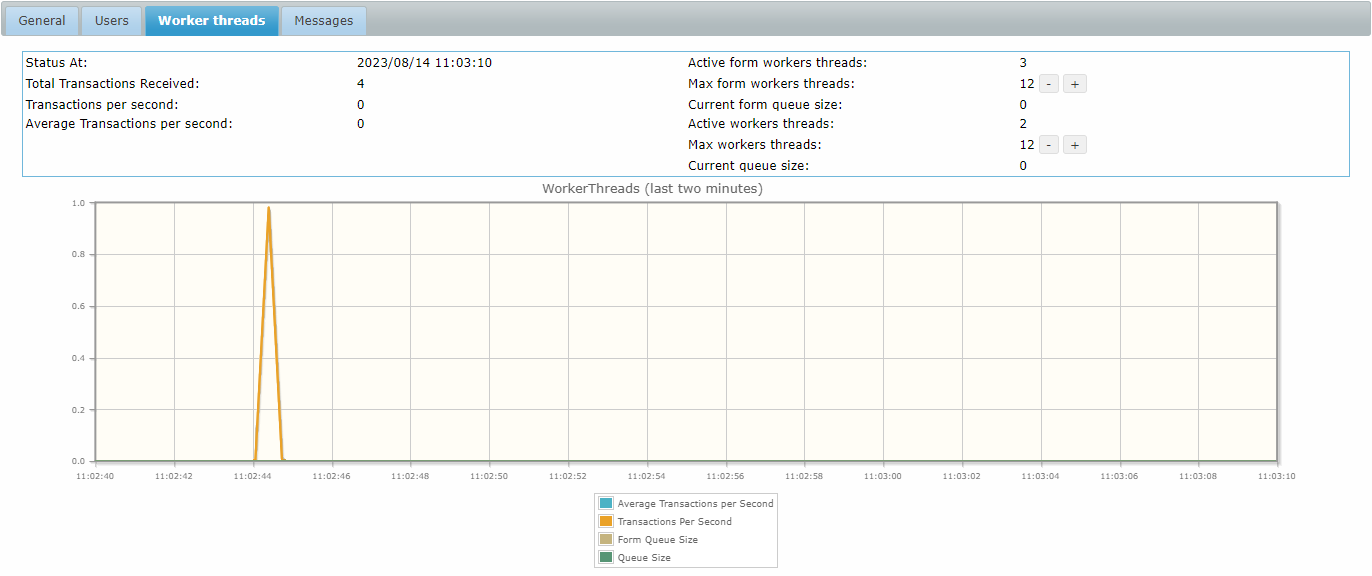
The maximum number of worker threads and form worker threads can be altered on the fly using the buttons in the top right.
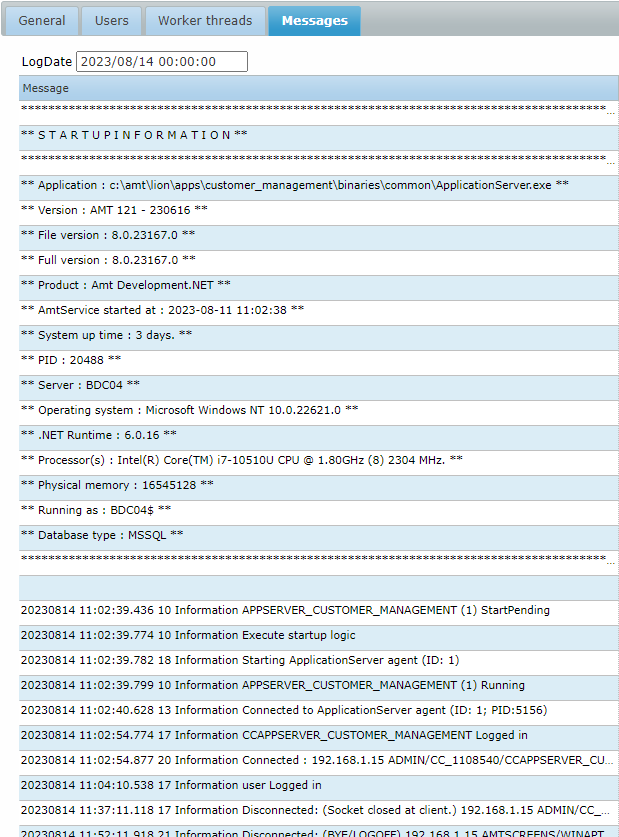
Messages
The Messages tab displays the log messages of the LION server. Using the calendar feature in this tab, any date from past can be selected to read the log information of that date. The messages are written to the following log file:
| %SYSROOT%\SystemLogging\<DATE>\<System name>_<LionServer name>.log |
| The messages in the log file are NOT the messages that can read in the Messages section of the Control Center. The Messages section displays messages that are written to the System Database. The messages shown in the Application Server's Messages tab are written to a log file on the server that the LION server runs on. |
LION Managers
There are two types of LION managers—the Application and Communication manager. The information tabs in the panel on the right side are the same as those described under LION Servers.
If spare Servers and Managers are used, while these are idle, they are displayed with the blue Standby ![]() icon.
icon.