Tracing Provided Web Services (.Net Core)
It is possible to trace the input and output of a Provided Web Service of an application, which saves debug information in four log files.
- Open the appsettings.json file (..\Binaries\Common\SoapProvider) in a text editor and find the AmtLogSeverity setting.
- Change the AmtLogSeverity value from Error to Debug.
 The value Debug is the only value that generates a trace output.
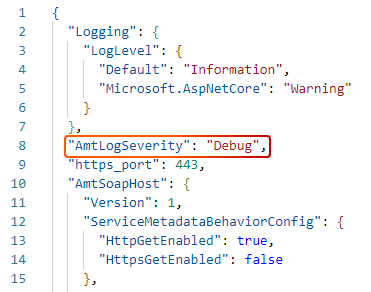
- Four log files are created in the ..\SoapProvider\App_Data\Logs\<Date> directory of the
application:
- AmtSoapHost.Log: Displays debug information about TCP socket connections to the Application Server or Manager.
- AmtSoapHost_Communication_Trace.Log: Displays debug information about the AmtCommunicateManager.
- AmtSoapHost_Network_Trace.Log: Displays debug information of network traffic as seen from the Consumable Web Service.
- AmtSoapHost_Trace.Log: Displays debug information of the Provided Web Service.
- Tracing of the Provided Web Service is now set up.
To disable debug mode, change AmtLogSeverity back to the default value Error.