Debugger Commands
After the debugger has been set up correctly and the connection to the application service has been started, these command can be used to step through the code.
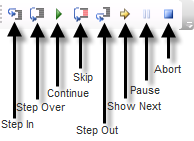
At the toolbar on top of the screen:
and
 |
 |
|
You have the following options
| Option |
Description |
|---|---|
|
Step In |
Clicking this button steps the program execution by one line of code. If the next line is a call to a routine, or an insertable form/report and routine or insertable has been generated in debug mode, then the debugger will step in to the code of this routine or insertable form/report. |
|
Step over |
Clicking this button advances the program execution to the next line of code. Unlike the “Step In” button, if this next line is a call to a routine, or an insertable form/report, then it will be treated as just another line of code, and the debugger will not step into the code of that routine or insertable form/report. Advancing past this line will cause the code of the routine or insertable form/report to be executed, but it will not be shown in the debug view. |
|
Continue |
To run the program until it encounters a break point or until it reaches the end of the program (or if it concerns a report: until the Halt button is clicked). |
|
Skip |
To skip the current instruction, and proceed with the next.
|
|
StepOut |
Clicking this button causes the execution to step out of the current routine. The remaining code is still executed, but is not shown in the debug view. If the current routine is ‘display_main’ or ‘process_main’, then the execution is to the end of the transaction. |
| Show Next | Clicking this button will show the next statement that will be executed. |
|
Halt / Pause |
To stop the execution of a form or report. This only applies to forms in case workerthreads are used. |
|
Abort |
To abort the current transaction, cancel the debugging and rollback the updates. |
|
To set the switch in the breakpoint checkbox for the line that is currently selected in the source frame. A breakpoint can be set on lines other than the highlighted line, by either clicking on that line of code and then clicking the ‘Breakpoint’ button, or by clicking the blue dot next to the line number. |
|
|
To specify under which conditions the execution (by using "Continue") is stopped. You can choose to stop or continue the execution depending on the value of a specified field, but it is also possible to define a break for when the value of a specified value is changed. All conditional breakpoints are considered to be connected through "OR". |
|
| Delete all breakpoints | Removes all the set breakpoints. |
Besides clicking on the icons in the toolbar or the run menu, you can also use keyboard shortcuts for the Debugger
commands.
The Debugger keyboard shortcuts are in line with other well known debugging solutions, however the older keyboard shortcuts also still work and can be used if preferred.
| Keys | Description | Lion 5.* Keys |
|---|---|---|
| Alt + * (Numeric Keypad) | Show Next Statement | |
| Ctrl + Alt + Break | Halt | H |
| Ctrl + F | Find | |
| Ctrl + G | Go To Line | Alt + G |
| Ctrl + Shift + F9 | Delete All Breakpoints. | |
| F3 | Find Next | |
| F5 | Continue | C |
| F9 | Toggle Breakpoint. | B |
| F10 | Step Over | N |
| F11 | Step In | I |
| Shift + F5 | Abort | O |
| Shift + F9 | Conditional Breakpoint. | |
| Shift + F10 | Skip | K |
| Shift + F11 | Step Out | P |