Setting up the Debugger
In order to use the debugger it needs some setting up. Liondebugger.exe can be found in the AmtTools\LionDebugger folder of the AMT installation directory.
Connect at Startup
Start up LionDebugger.exe and a popup screen with connection options shows.
The type of server which the AMT debugger should connect to depends on the object that needs to be debugged.
To debug reports a 'BatchController' should be selected to connect to.
To debug forms, an 'Application' (server) or 'Manager' should be used.If an Application Manager is configured for an AMT Application, the debugger should always connect to the Manager instead of one of its servers directly.
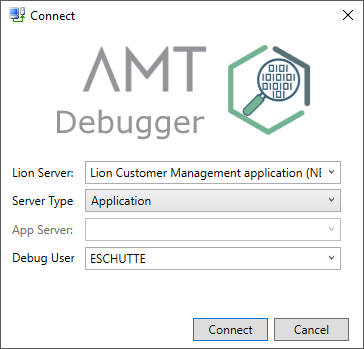
The connect window has the following options:
- Lion server: A description of the application service or batch controller to which the AMT Debugger should connect. The server name and port number used are displayed in brackets after the description, divided by a space.
- Server type: Choose between 'Application' and 'Manager' to debug forms and provided REST APIs or 'BatchController' for reports. The option 'TransactionServer' is not applicable for Lion Applications.
- App Server/Application: When 'Manager' has been selected, a choice between the different Application servers can be made. When 'BatchController' has been selected, a list of applications will be displayed after pressing the 'Connect' button once. The desired application should then be selected.
- Debug User: The User Name of the developer to use the debug versions of objects of.
Click Connect and the debugger will connect to the application service or batch controller. If it fails to connect, check if the service is running.
Server settings
The first time the debugger is connected, the application service values as well as the path to the AmtScreens
application and/or the Web Client Url has to be filled in Tools > Options > Server settings. This dialog
can also be used to add more applications for debugging.
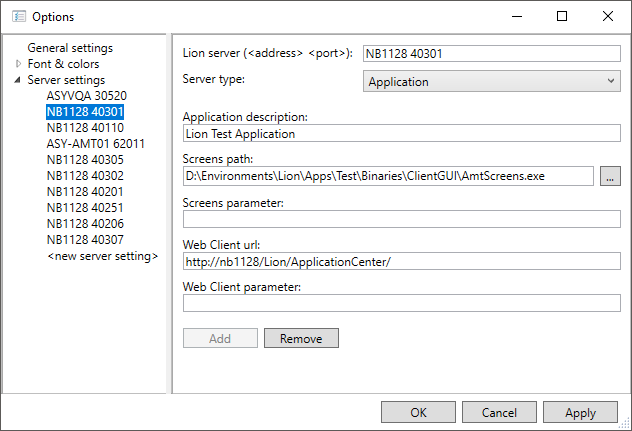
- Lion Server: Server name and Debugger port number used to connect to the AMT service, divided by a space. See Lion Servers, Lion Managers and Batch Services.
- Server Type: Choose between 'Application' and 'Manager' to debug forms and provided REST API or 'BatchController' for reports. The option 'TransactionServer' is not applicable for Lion Applications.
- Application Description: A free to choose description of the application, will be displayed as entry in the Lion Server drop-down menu on the 'Connect' screen.
The options below are needed for the types 'Application' and 'Manager' to be able to debug forms, for the 'BatchController' type used to debug reports, these may be left empty.
- Screens Path: The complete path to the Amt Screens executable of the application. In case the ClientGui folder is a shared directory mapped and accessed from a workstation, on which the shared directory is mapped to a drive letter, the entry here would simply be the drive letter with the executable (e.g. U:\AmtScreens.exe ).
- Screens Parameter: Optional extra parameters for AMT Screens can be set here.
- Web Client url: The Url of the Application Center
- Web Client Parameter: Optional additional parameters, for example login information when needed.
For each application server or manager that has to be debugged the (Lion/Amt) Screens Path and/or the Web Client
Url has to be filled once. Select the correct application server and fill the path and/or url. All services which have
been connected once will be remembered. When later a connection to the server is made the correct Screens path
and/or the Web Client Url will be used.
General Settings
Using the Tools -> Options -> General settings dialog three startup settings can be selected.
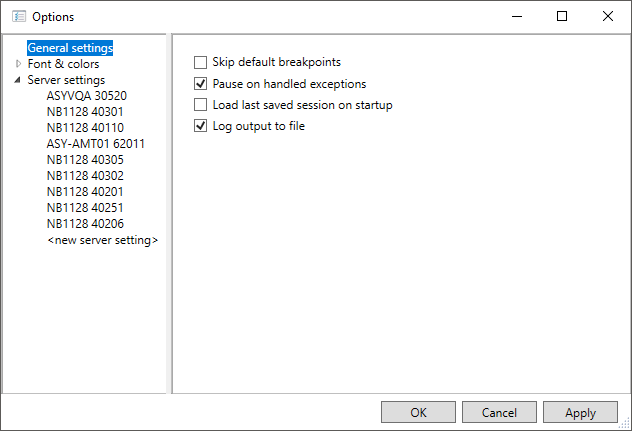
- 'Skip Default Breakpoints': When checked the debugger will skip the default breakpoints when starting a form or report and go directly to the manual setting of breakpoints. After changing this option, the debugger application will need to be closed and restarted before it will take effect.
- 'Pause on handled exceptions': With this option set the debugger will pause when a handled exception is encountered and will display the exception. This option is on by default, after changing this option a reconnect is required.
- 'Load last saved session on startup': When checked the debugger will load the last save session on startup of the debugger.
- 'Log output to file': When checked the debugger will create logfiles with the output of the debugger to the folder <debugger folder>\Log\<Date> e.g. D:\AMT\AmtTools\LionDebugger\Logs\20160607\
Font & colors
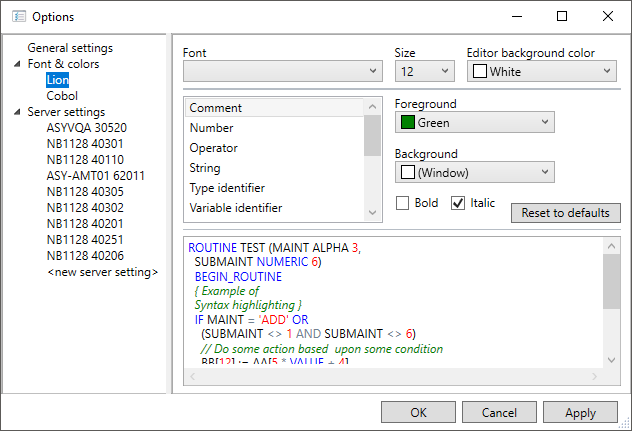
Using the Tools -> Options dialog the fonts and colors used in the debugger can be altered in the Fonts & Colors section of the Options screen for your AMT language. Just choose the Display Element and change the desired settings.
Saving and reloading settings
Settings can be saved by using the File -> Export Settings menu option. The settings are saved in a textfile of
type .DebugSettings. These settings can be reloaded with the File -> Import Settings menu option.