Start Debugging
Running debug forms
Before forms can be debugged a connection to the correct application server has to be created and the path to the
correct AmtScreens.exe and/or the Web Client Url to use has to be set, see Setting up the Debugger.
There are a few ways to start debugging a form. All ways require that the debugger has been started and a
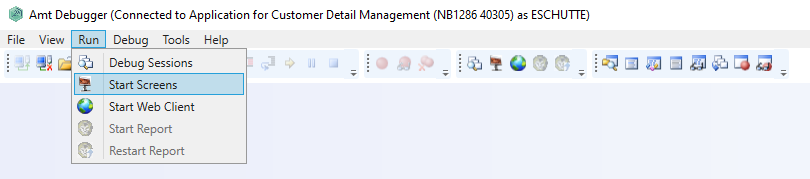
connection has been made to the correct application server. Then click in the debugger on the menu Run and
then Start Screens or Start Web Client. The same buttons can be found on the toolbar. Alternatively you can start
the application with AMT Screens using the parameter debug (ie. AmtScreens.exe /debug), or use the
Web Client by adding the suffix ?Debug=true (e.g. http://localhost/AMT/ApplicationCenter/?Debug=true ). When
a debug session of AMT Screens is started, the message "DEBUG" in red text will be displayed in the status bar as a
visual indicator to show that this is a debug session.
| When Debugging on an Amt Environment with an application manager, it is possible that starting the thin client
manually, with the debug parameter, will connect you to another application server than the debugger is
connected to. This can be avoided by forcing the thin client to connect to a specified application server with
the /OVERRIDESERVER:"<servername> <port>" switch. Starting the thin client from the Amt Debugger will automatically connect the thin client to the correct application server. |
When running a form that has been generated for debugging, the additional debug functionality that is presented in the debugger depends on which part (routine code or layout) is currently being handled. A full listing of the additional debug functionality is available on the page: Debugger Commands.
The concerned functionality is not available while performing the global routines STARTUP or CLOSEDOWN. However, when it is required, you can copy the STARTUP/CLOSEDOWN code into a form and debug it there.
Please note that there is a decrease in performance when running a form in debug mode. This is because every instruction in a debug form is sent separately to the Application server which returns a separate reply. When running a form normally, the whole screen is sent to the Application server at once. The Application server then performs the instructions and sends the result back to the client. So, when running a debug form there is more interaction between the client and the Application server, which causes the performance loss.
When debugging with the web client, normally the debug session is closed by closing the web client. However if the startup code is being debugged, the close down trigger will not reach the server correctly. In that case the debug session can only be closed manually using the 'Debug sessions' screen (see below).
Running debug reports
Before reports can be debugged, a connection to the batch controller and the correct application has to be created. See Setting up the Debugger.
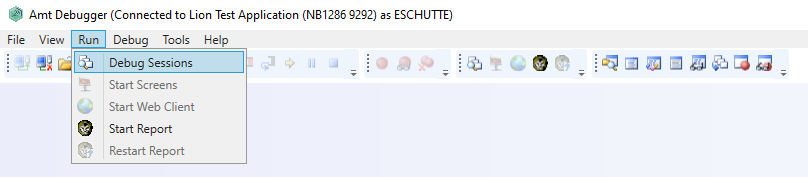
A debug report can be started via the debugger using the menu Run and then start Report or the start Report icon on the toolbar. After having debugged a report, the same report can be debugged again by selecting the Restart Report option. In the same way as for forms, additional debug functionality is presented when debugging a report. A full listing of the additional debug functionality is available on the page: Debugger Commands.
When a report is debugged that includes one or more call statements, the debugger always searches for the call dll files in the call files directory. To track this directory, AMT uses also on the client site the call-files path parameter that is specified in the basepath in the ControlCenter. If you refer to a shared network drive/ folder (e.g. "E:\DEMO2\CALLS"), it is important to keep in mind that exactly the same network share must also be available on every client site where the concerned debug report is used.
| The debugger can only debug one form or report at the same time. |
ComScript Debug Jobs
It is also possible to debug a report started by a Comscript script in the AMT Debugger.
- Generate the AMT Object with the 'Private Debug' option enabled.
- Set the Debug property
of the Job
Object to True in the ComScript script.
For example in PowerShell:
$Job.Debug = $true
- Run the Comscript script.
- Open the AMT Debugger and connect to the BatchController service.
- Open the job and select Start Report. The following window appears:
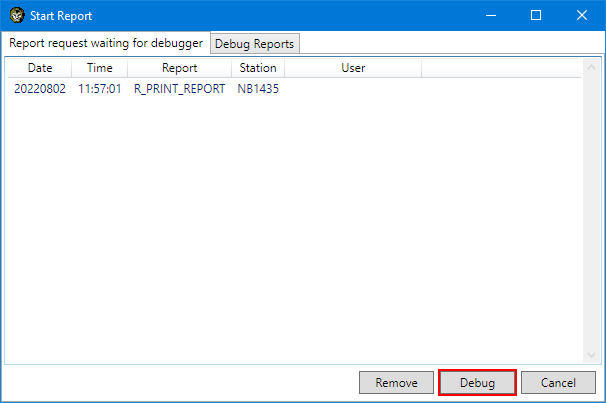
- In the tab Report request waiting for debugger, select the Job started by the ComScript script from the list and select the Debug button to begin debugging.
Debug sessions
Debug sessions can be detached, (re)attached, aborted or killed with the "Debug Sessions" button on the toolbar or the same option in the run menu.
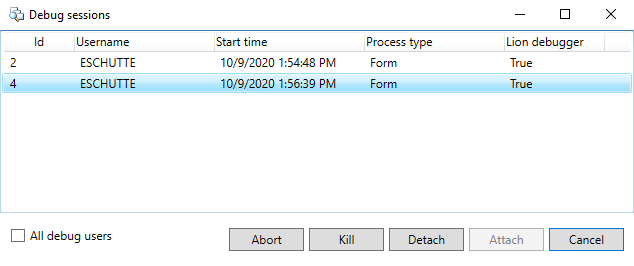
In past AMT versions, old debug sessions that are still active were automatically reconnected, this is no longer the case. Debug sessions can now manually be re-attached, aborted (close the session) or "killed" (forcefully end the debug session, this may keep the resources locked) using this screen.
It is also possible to detach your current session in order to start debugging a different item. When reports are detached, they will continue to run normally and close the session at the end of their run, causing the session to disappear from the list.