Bar Chart
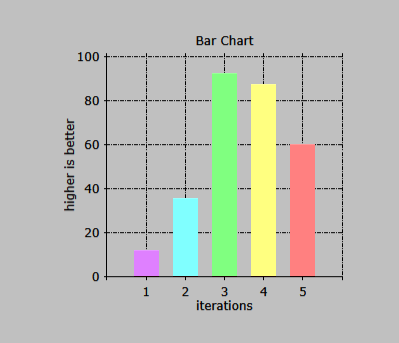
A bar chart consists of several vertical bars, one for each data point entered. and the height according to the value of the data point as shown in the image example below.
Negative values are allowed.
The datapoints can be entered with the function ADD or ADDXY.
When enterering datapoints using the ADD function only the Y value needs to be specified. The first datapoint added in a series will get the X value specified in the property StartOnXAxis for that series and on each subsequent added datapoint the X value will get incremented with the value specified in the property StepSize.
When entering datapoints using the ADDXY function both the X value and the Y value of each datapoint must be specified. The datapoints can be entered in any order.
Note: The functions ADD and ADDXY cannot be mixed.
Data displayed
A bar chart can be used to display multiple datasets up to a total of 12, in LION called series[1] to series[12]. Only series with non zero data values will be displayed. The data to display can be entered using one of the commands with the following syntax:
<BarChartObject>.series[<NN>].add (<Yvalue>[, <Label>])
or
<BarChartObject>.series[<NN>].addxy (<Xvalue>, <Yvalue>[, <Label>])
Where:
- <BarChartObject> is the name of the graphic chart object added in the layout
- <NN> is the number of the series, from 1 to 12
- <Xvalue> the X value of the datapoint to add when ADDXY is used, negative values are allowed.
- <Yvalue> the Y value of the datapoint to add, negative values are allowed.
- <Label> an optional label text to display at the datapoint. This label text will only be shown when the property ChartMark is set to a value which uses the label text.
For further explanation of the usage of chart coding see Series Coding.
The total interval displayed in the chart can be set using the
properies MinValueX, MaxValueX, MinValueY and MaxValueY. When set to
zero the interval displayed will be set automatically to display all
datapoints.
The distance between the gridlines in the chart can be set using the
properties StepSizeX and StepSizeY. When set to zero the interval will
be chosen automatically.
When the property Set_X_Axis_To_Zero is set to True, the Y-axis will
be displayed at the zero value of the X-axis instead of at the left of
the chart, default is False. When the property Set_Y_Axis_To_Zero is set
to True, the X-axis will be displayed at the zero value of the Y-axis
instead of at the bottom of the chart, default is False.
Individual series can be cleared with the <BarChartObect>.series[<NN>].clear() command.
Code Example
The chart shown above was created using the following code:
rev := 10 * i ** 2
chart_bar.series[1].add (rev)
rev := 200 - rev
chart_bar.series[2].add (rev)
rev := 50 * ( i - 2 ) ** 2
chart_bar.series[3].add (rev)
endloop
Properties
Static properties:
- AxisTextX
- AxisTextY
- ChartKind
- ChartMark
- ChartSeries
- Color
- DecimalChar
- Description
- Font
- Footing
- Height
- HelpText
- Left
- Legend
- MaxValueX
- MaxValueY
- MinValueX
- MinValueY
- Name
- Parent
- Set_X_Axis_To_Zero
- Set_Y_Axis_To_Zero
- StepSize
- StepSizeX
- StepSizeY
- ThousandSeparator
- Title
- Top
- Visible
- Width
- XLabels
- ZOrder
Dynamic properties:
- Color
- FontBold
- FontColor
- FontName
- FontSize
- Left
- MaxValueX
- MaxValueY
- MinValueX
- MinValueY
- Series[n].Add
- Series[n].AddXY
- Series[n].Clear
- Set_X_Axis_To_Zero
- Set_Y_Axis_To_Zero
- StepSize
- StepSizeX
- StepSizeY
- Top
- Visible
- XLabels
Legacy Properties (unsupported):
- BorderStyle
- FontItalic
- FontUnderline